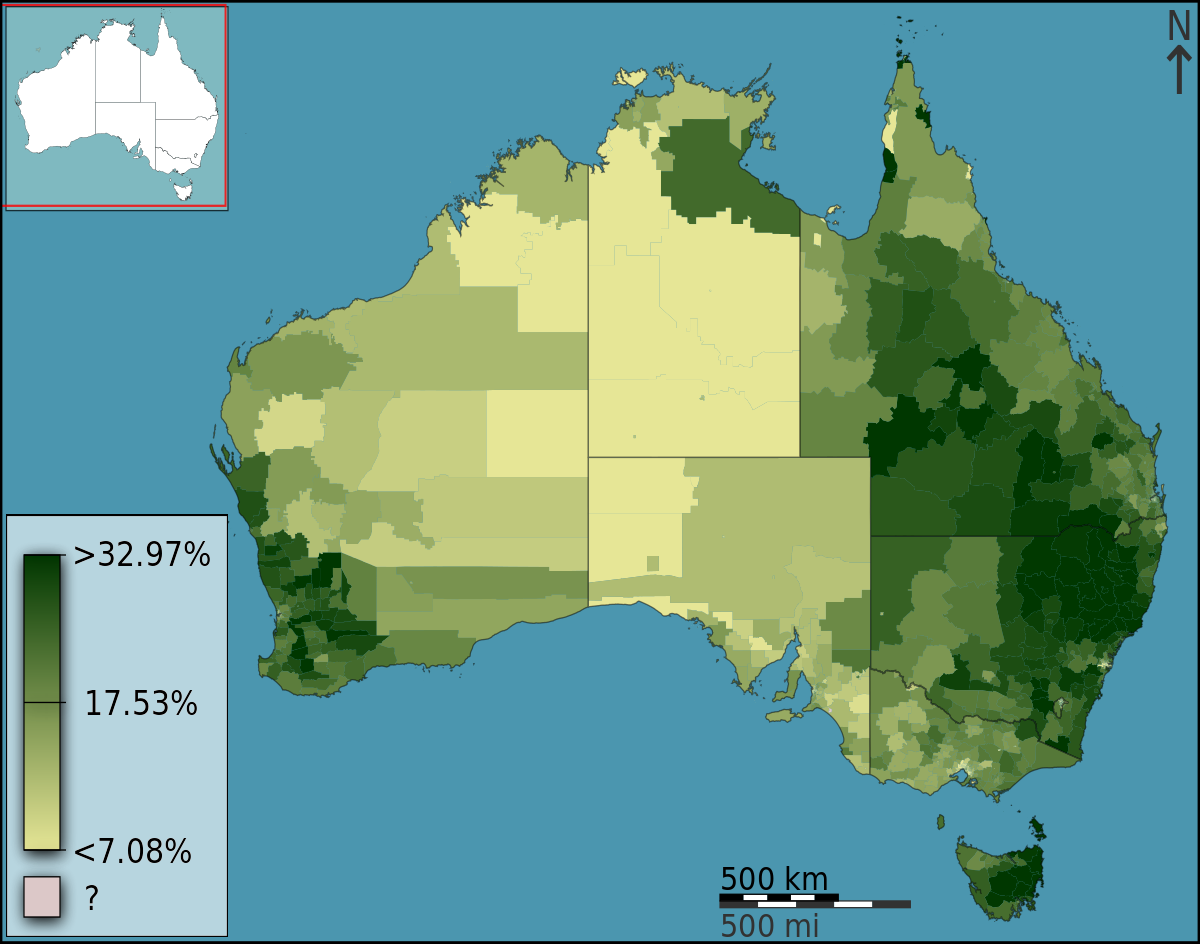
Choropleth Mapping

https://www.youtube.com/watch?v=NvYmY7b8sPE
What are the variables in a Choropleth map? The variables are _____________.
How might the colors change? The colors may change by ___.
What are the negatives of the Choropleth maps? The negatives of a Choropleth map are ____________________.
Is it better to include more or less values?
Let's have some fun. Develop your own Choropleth map for the high school graduation rate in Colorado. Develop your own scale and key and color in the counties.

What surprised you about the high school rates in Colorado? I was surprised that ____________.
How would the map change if you focused down to the town/city level?
Is there a difference between urban and rural areas?
What was your impression of developing a Choropleth map?
Comments
Post a Comment